Cup Snakes – Describing Linear Change
A video introduction presents the mathematics of cup snakes, a hands on phenomena involving additive change that gives rise to a way to think about linear growth. Modeling this phenomena theoretically, with the help of two cups, and through data, with the help of many, many cups, these videos give rise to some of the big ideas around developing and using linear algebraic models to describe additive bi-variate change. These ideas are then unpacked in the accompanying ‘chapter replacement’ booklet.

Category:
Videos for Learning
Technology:
CLASSPAD 300/330, CLASSPAD FXCP400, FX100AU, FX82AU, FX9860GAU, FXCG20/50AU
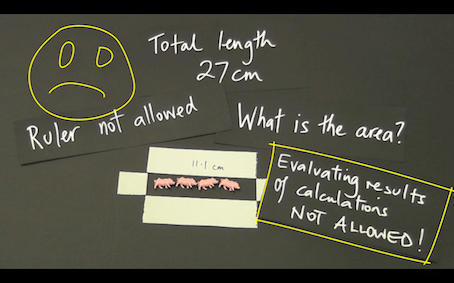
Pigs, Pens and Mathematics
Pigs, pens and mathematics is a two to four lesson, tried and proven, activity that moves students from measurement-thinking to functional-thinking with the help a simple but rarely used idea – do not evaluate a calculation.
A small, but authentic and enlightening use of electronic technology is made.
It would fit perfectly in a measurement topic at any of the years 8 to 11.
In this collection of resources you will find:
a) a two-part introductory video, that can be played to the class to kick things off,
b) one support video that shows “how to” do the technical stuff on the CG 20 AU,
c) one support video that explores the mathematical ideas that can be developed with the help of the technology,
d) one ‘task sheet’ for students to work on after watching the videos or being instructed by the teacher,
e) a complete ‘unit of work’ that allows students to consolidate the mathematical ideas and skills they have learned.
CGA11 Solving a system of simultaneous equations
This short video shows how to solve a system of linear simultaneous equations using the Equation app of a CASIO fx-CG series graphics calculator. CG20 AU and CG50 AU versions presented.
CG223 Fitting a regression model to bivariate data
This short video shows how to generate a regression model of “best fit” for bivariate data via a scatterplot drawn using the Statistics app of a CASIO fx-CG series graphics calculator. CG20 AU and CG50 AU versions presented.
CGA31 Solving an equation
This short video shows how to solve ‘any’ equation using the numerical solver in the Equation app of a CASIO fx-CG series graphics calculator. CG20 AU and CG50 AU versions presented. Changing the ‘seed’ to obtain an alternative solution, and the graphical representation of multiple solutions, is included.
CGA32 Solving for unknowns in formulae
This short video shows how to find the value of an unknown, via the substitution of known values into a formula and the use of the numerical Solver in the Equation app of a CASIO fx-CG series graphics calculator. CG20 AU and CG50 AU versions presented.
CGI11 Fitting a function to a picture
This short video shows you how to fit a quadratic function to a picture of the Sydney Harbour Bridge using the Picture Plot app of a CASIO fx-CG20AU.
CG111 Calculating with fractions
This short video shows how to operate with fractions using the Run.Mat app of a CASIO fx-CG series graphics calculator. CG20 AU and CG50 AU versions presented.
CG113 Converting units of measurement
This short video shows how to convert measurement values like temperature and area between different units of measurement using the Run-Matrix app of a CASIO fx-CG series graphics calculator. CG20 AU and CG50 AU versions presented.
CG112 Calculating recursively using Ans
This short video shows how to perform recursive calculations, in this case involving compound interest, using the Ans command in the Run.Mat app of a CASIO fx-CG series graphics calculator. CG20 AU and CG50 AU versions presented.