Flow – Ideas that underpin Differential Calculus
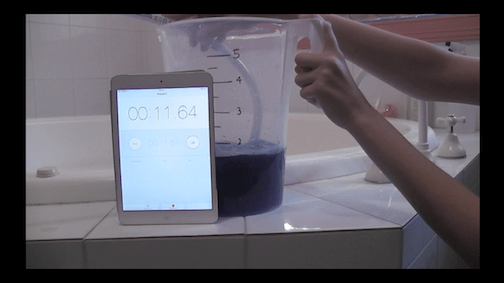
Presented here is a tried and proven three to five lesson sequence that begins with an engaging real-world context and grows students from the idea of average rate of change to instantaneous rate of change.
It is accessible to any student who has an understanding of average and gradient.
In this collection of resources you will find: a) a three-part introductory video (I, IIa and IIb), which structures the sequence of learning, b) two support video that shows “how to” do the technical stuff on the CG 20 AU.
Logarithms – when adding is multiplying (9860)
This unit aims to provide a simple/useful way to thing about logarithms when first meting them.
We use two examples of “hard” to graph data (due to the extreme range in the values) to alert students to the idea of thinking about a number as its power, as opposed to its absolute value.
The rest of the unit aims to establish a way to think about calculating with logarithms that will set a sound foundation for later on and that builds on their knowledge of ‘indices’ from previous years.
Category:
Replacement Units Archives
Technology:
Resources for Learning
CG211 Entering and editing data in lists
This short video shows how to enter lists of data, and how to duplicate and edit these lists, using the Statistics app of a CASIO fx-CG series graphics calculator. CG20 AU and CG50 AU versions presented.
* This video stands alone but also can be viewed as Part 1 of a 5-part series of videos on working with univariate data.
* These videos cover entering and editing data, obtaining a 1-variable analysis, drawing histograms and box plot(s).
* The 5 videos are numbered CG211, CG212, … , CG215
CG212 Obtaining a 1-variable analysis of list data
This short video shows how to obtain a one variable analysis for list data, including values such as mean, median, standard deviation etc, using the Statistics app of a CASIO fx-CG series graphics calculator. CG20 AU and CG50 AU versions presented.
* This video stands alone but also can be viewed as Part 2 of a 5-part series of videos on working with univariate data.
* These videos cover entering and editing data, obtaining a 1-variable analysis, drawing histograms and box plot(s).
* The 5 videos are numbered CG211, CG212, … , CG215
CG213 Drawing a histogram of lists data
This short video shows how to draw a histogram of list data using the Statistics app of a CASIO fx-CG series graphics calculator. CG20 AU and CG50 AU versions presented.
* This video stands alone but also can be viewed as Part 3 of a 5-part series of videos on working with univariate data.
* These videos cover entering and editing data, obtaining a 1-variable analysis, drawing histograms and box plot(s).
* The 5 videos are numbered CG211, CG212, … , CG215
CG713 Using a table of values
This video shows how to use a table of values to investigate the behaviour of a function, in particular when it takes a zero value, using the Table app of a CASIO fx-CG20 AU.
CG214 Drawing a boxplot of list data
This short video shows how to draw a boxplot for list data using the Statistics app of a CASIO fx-CG series graphics calculator. CG20 AU and CG50 AU versions presented.
* This video stands alone but also can be viewed as Part 4 of a 5-part series of videos on working with univariate data.
* These videos cover entering and editing data, obtaining a 1-variable analysis, drawing histograms and box plot(s).
* The 5 videos are numbered CG211, CG212, … , CG215
CG222 Finding a linear model of ‘best fit’ for bivariate data
This short video shows how to determine a line of best fit for bivariate data via a scatterplot drawn using the Statistics app of a CASIO fx-CG series graphics calculator. CG20 AU and CG50 AU versions presented.
CG215 Drawing multiple boxplots of list data
This short video shows how to enter lists of data, and how to duplicate and edit these lists, using the Statistics app of a CASIO fx-CG series graphics calculator. CG20 AU and CG50 AU versions presented.
* This video stands alone but also can be viewed as Part 5 of a 5-part series of videos on working with univariate data.
* These videos cover entering and editing data, obtaining a 1-variable analysis, drawing histograms and box plot(s).
* The 5 videos are numbered CG211, CG212, … , CG215
CG712 Generate and plot a table of values
This short video shows how to generate a table of values, along with a plot of the table, for a function using the Table app of a CASIO fx-CG series graphics calculator. CG20 AU and CG50 AU versions presented.