CG514 Finding x and y values using a graph
This short video shows how to determine a function’s x and y values from its graph, using the Graph app of a CASIO fx-CG series graphics calculator. CG20 AU and CG50 AU versions presented.
Category:
'How to' on Graphics/Non-CAS Archives
Technology:
FXCG50AU, Resources for Learning
Year Level:
Year 10 Archives, Year 11 Archives, Year 12 Archives, Year 8 Archives, Year 9 Archives
State:
ACT Archives, NT Archives, QLD Archives, SA Archives, TAS Archives
CG515 Changing a graph’s View Window
This short video shows how to change a graph’s View Window, using the Graph app of a CASIO fx-CG series graphics calculator, and discusses some of the advantages and disadvantages of different View Window settings. CG20 AU and CG50 AU versions are presented.
Category:
'How to' on Graphics/Non-CAS Archives
Technology:
FXCG50AU, Resources for Learning
Year Level:
Year 10 Archives, Year 11 Archives, Year 12 Archives, Year 8 Archives, Year 9 Archives
State:
ACT Archives, NT Archives, QLD Archives, SA Archives, TAS Archives
CG115 Performing trigonometric calculations
This short video shows how to perform trigonometric calculations using the Run-Matrix app of a CASIO fx-CG series graphics calculator in order to solve simple trigonometric equations. CG20 AU and CG50 AU versions are presented.
Category:
'How to' on Graphics/Non-CAS Archives
Technology:
FXCG50AU, Resources for Learning
Year Level:
Year 10 Archives, Year 11 Archives, Year 9 Archives
State:
ACT Archives, NT Archives, QLD Archives, SA Archives, TAS Archives
Exponential and trigonometric functions
A selection of documents that share some nice ideas about exponential functions, trigonometric functions and a lovely context where both concepts come together.
Category:
CASIO Education General Resources
Technology:
CLASSPAD FXCP400 Resources, FXCG50AU, How to scientific calculator resources
Year Level:
Year 10 Archives, Year 11 Archives, Year 12 Archives
State:
ACT Archives, NSW Archives, NT Archives, QLD Archives, SA Archives, TAS Archives, Teacher Resources, VIC Archives
A quick list of sample means.
Download a program that will creates the number of samples you desire, of a size you define from a normal population with standard deviation and mean you define.
Category:
CASIO Education General Resources
Technology:
FXCG50AU
Year Level:
Year 10 Archives, Year 11 Archives, Year 12 Archives
State:
ACT Archives, NSW Archives, NT Archives, QLD Archives, SA Archives, TAS Archives, Teacher Resources, VIC Archives
Developing ways-of-thinking about the ideas that form calculus
This video and documents outline a 4 session course that aim to assist students to develop the optimal ways-of-thinking about the ideas that underpin calculus.
Category:
CASIO Education General Resources
Technology:
How to scientific calculator resources, Resources for Learning
Year Level:
Year 11 Archives, Year 12 Archives
State:
ACT Archives, NSW Archives, NT Archives, QLD Archives, SA Archives, TAS Archives, Teacher Resources, VIC Archives
The Confidence Interval for a Proportion
Understanding the confidence interval for a population proportion (p) This video is a Zoom-recording of a virtual lecture/talk, in which the presenter shares a tried and proven way to present the ideas that underpin the confidence interval for a population …
Category:
CASIO Education General Resources
Technology:
FXCG50AU
Year Level:
Year 11 Archives, Year 12 Archives
State:
ACT Archives, NSW Archives, NT Archives, QLD Archives, SA Archives, TAS Archives, Teacher Resources, VIC Archives
Cup Snakes – Describing Linear Change
A video introduction presents the mathematics of cup snakes, a hands on phenomena involving additive change that gives rise to a way to think about linear growth. Modeling this phenomena theoretically, with the help of two cups, and through data, with the help of many, many cups, these videos give rise to some of the big ideas around developing and using linear algebraic models to describe additive bi-variate change. These ideas are then unpacked in the accompanying ‘chapter replacement’ booklet.

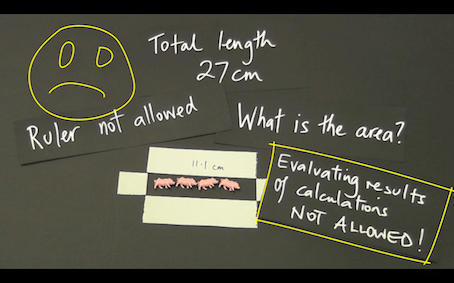
Pigs, Pens and Mathematics
Pigs, pens and mathematics is a two to four lesson, tried and proven, activity that moves students from measurement-thinking to functional-thinking with the help a simple but rarely used idea – do not evaluate a calculation.
A small, but authentic and enlightening use of electronic technology is made.
It would fit perfectly in a measurement topic at any of the years 8 to 11.
In this collection of resources you will find:
a) a two-part introductory video, that can be played to the class to kick things off,
b) one support video that shows “how to” do the technical stuff on the CG 20 AU,
c) one support video that explores the mathematical ideas that can be developed with the help of the technology,
d) one ‘task sheet’ for students to work on after watching the videos or being instructed by the teacher,
e) a complete ‘unit of work’ that allows students to consolidate the mathematical ideas and skills they have learned.
Category:
Videos for Learning
Technology:
FXCG50AU
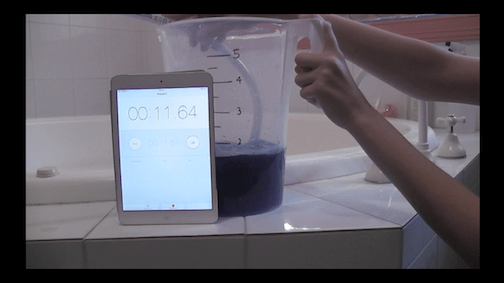
Flow – Ideas that underpin Differential Calculus
Presented here is a tried and proven three to five lesson sequence that begins with an engaging real-world context and grows students from the idea of average rate of change to instantaneous rate of change.
It is accessible to any student who has an understanding of average and gradient.
In this collection of resources you will find: a) a three-part introductory video (I, IIa and IIb), which structures the sequence of learning, b) two support video that shows “how to” do the technical stuff on the CG 20 AU.
Category:
Videos for Learning
Technology:
FXCG50AU