

This unit aims to provide a simple/useful way to thing about logarithms when first meting them.
We use two examples of “hard” to graph data (due to the extreme range in the values) to alert students to the idea of thinking about a number as its power, as opposed to its absolute value.
The rest of the unit aims to establish a way to think about calculating with logarithms that will set a sound foundation for later on and that builds on their knowledge of ‘indices’ from previous years.
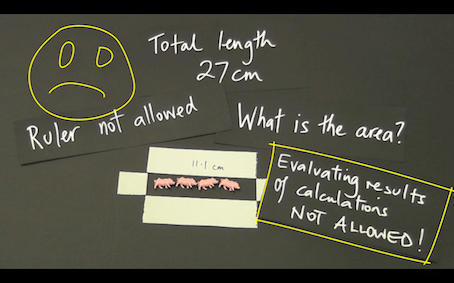
Pigs, pens and mathematics is a two to four lesson, tried and proven, activity that moves students from measurement-thinking to functional-thinking with the help a simple but rarely used idea – do not evaluate a calculation.
A small, but authentic and enlightening use of electronic technology is made.
It would fit perfectly in a measurement topic at any of the years 8 to 11.
In this collection of resources you will find:
a) a two-part introductory video, that can be played to the class to kick things off,
b) one support video that shows “how to” do the technical stuff on the CG 20 AU,
c) one support video that explores the mathematical ideas that can be developed with the help of the technology,
d) one ‘task sheet’ for students to work on after watching the videos or being instructed by the teacher,
e) a complete ‘unit of work’ that allows students to consolidate the mathematical ideas and skills they have learned.
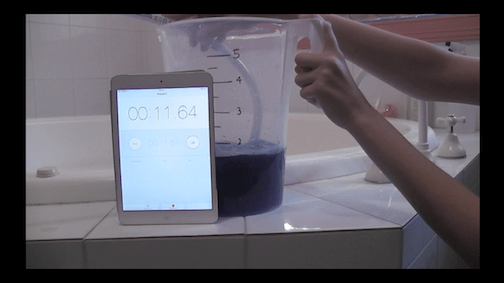
Presented here is a tried and proven three to five lesson sequence that begins with an engaging real-world context and grows students from the idea of average rate of change to instantaneous rate of change.
It is accessible to any student who has an understanding of average and gradient.
In this collection of resources you will find: a) a three-part introductory video (I, IIa and IIb), which structures the sequence of learning, b) two support video that shows “how to” do the technical stuff on the CG 20 AU.
A selection of documents that share some nice ideas about exponential functions, trigonometric functions and a lovely context where both concepts come together.
This short video shows how to operate with fractions using the Run.Mat app of a CASIO fx-CG series graphics calculator. CG20 AU and CG50 AU versions presented.
This short video shows how to calculate the Greatest Common Divisor (GCD) and Lowest Common Multiple (LCM) of two integers using the Run-Matrix app of a CASIO fx-CG series graphics calculator. CG20 AU and CG50 AU versions presented.
This short video shows how to generate a regression model of “best fit” for bivariate data via a scatterplot drawn using the Statistics app of a CASIO fx-CG series graphics calculator. CG20 AU and CG50 AU versions presented.
This short video shows how to draw a scatterplot for bivariate data using the Statistics app of a CASIO fx-CG series graphics calculator. CG20 AU and CG50 AU versions presented.
This short video shows how to perform recursive calculations, in this case involving compound interest, using the Ans command in the Run.Mat app of a CASIO fx-CG series graphics calculator. CG20 AU and CG50 AU versions presented.
This short video shows how to convert measurement values like temperature and area between different units of measurement using the Run-Matrix app of a CASIO fx-CG series graphics calculator. CG20 AU and CG50 AU versions presented.